

 Image:
The heatwave now hitting parts of western Canada and the US has been particularly devastating. This Copernicus Sentinel-3 image shows land surface temperature.
Image:
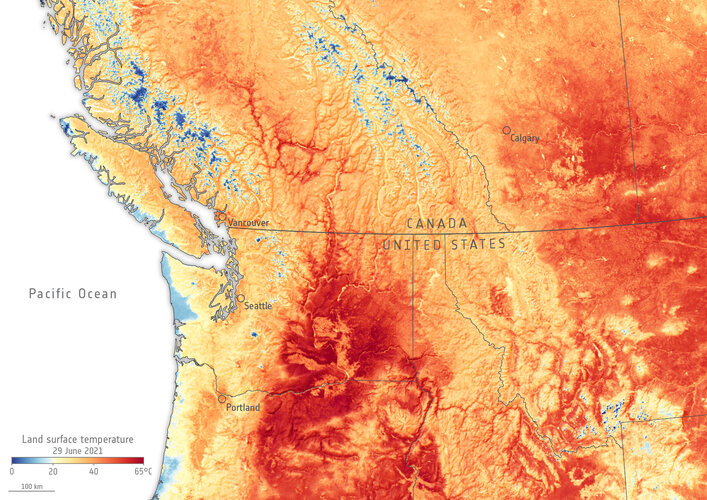
The heatwave now hitting parts of western Canada and the US has been particularly devastating. This Copernicus Sentinel-3 image shows land surface temperature. While heatwaves are quite common during the summer months, the scorching heatwave hitting parts of western Canada and the US has been particularly devastating – with temperature records shattered and hundreds of people falling victim to the extreme heat.
Canada broke its temperature record for a third consecutive day: recording a whopping 49.6°C on 29 June in Lytton, a village northeast of Vancouver, in British Columbia.
Portland, Oregon, also broke its all-time temperature record for three days in a row.
The extent of the heatwave can be seen in this map, which shows the land surface temperature of parts of Canada and the US on 29 June. The data show that surface temperatures in Vancouver reached 43°C, and Calgary and Portland recorded 43°C. The hottest temperatures recorded are in the state of Washington (visible in deep red) with maximum land surface temperatures of around 69°C.
The map has been generated using data from the Copernicus Sentinel-3 mission. While weather forecasts typically use air temperatures, the Sea and Land Surface Temperature Radiometer onboard Sentinel-3 measures the energy radiating from Earth’s surface. Therefore, the map shows the actual temperature of the land’s surface pictured here, which can be significantly hotter or colder than air temperatures.
The light blue in the image represents either snow and ice or cloud coverage. Snow and ice can be seen, for example, in the mountain ranges of Canada and Mount Rainier in the US, while some clouds can be seen on the Pacific Coast and in the bottom right of the map.
The persistent heat over parts of western Canada and parts of the US has been caused by a heat dome stretching from California to the Arctic. Temperatures have been easing in coastal areas, but there has been little respite for the inland regions.